Best YouTube Channels to Learn Data Visualization
Ever looked at a complex data set and wished you could make it as easy to understand as a picture?
That’s where the best YouTube channels to learn Data Visualization come in, turning numbers and stats into clear, cool visuals that anyone can get.
10 Best YouTube Channels for Data Visualization – Overview
Here’s an overview of top 10 YouTube channels to learn Data Visualization, with links to their channel homepage:
| S.No. | Channel Name | Subscribers | No. of Videos | Avg Duration of Videos | Channel Link |
| 1 | Guy in a Cube | 538K | 1204 | 10 min | Subscribe |
| 2 | Alex The Analyst | 1.32M | 436 | 10 min | Subscribe |
| 3 | Andy Kriebel | 78.6K | 821 | 10 min | Subscribe |
| 4 | Akshit Madan | 67.1K | 374 | 10 min | Subscribe |
| 5 | Storytelling with Data | 77K | 162 | 10 min | Subscribe |
| 6 | Data Science Tutorials | 69.2K | 1172 | 10 min | Subscribe |
| 7 | Information Lab | 22K | 663 | 5 min | Subscribe |
| 8 | PyLenin | 16.8K | 133 | 5 min | Subscribe |
| 9 | Data Visualization Society | 9.95K | 379 | 20 min | Subscribe |
| 10 | DataCamp | 207K | 2,384 | Varies | Subscribe |

Best YouTube Channels to Learn Data Visualization
Below is the list of best YouTube channels to learn Data Visualization:
1. Guy in a Cube
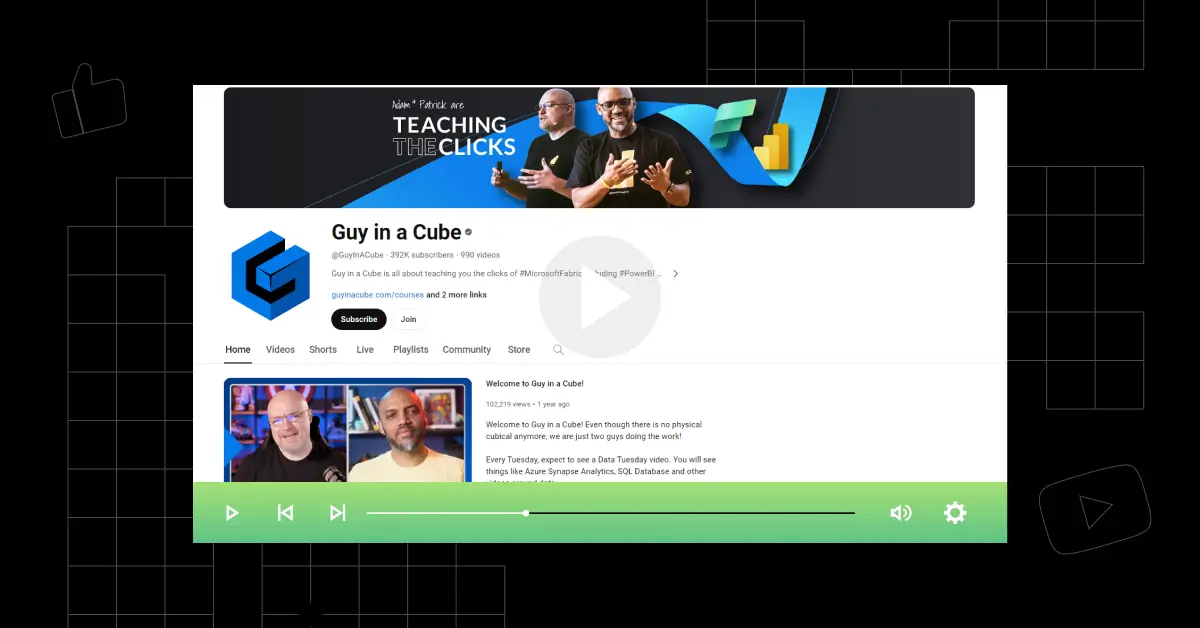
The “Guy in a Cube” YouTube playlist titled “Getting Started with Power BI” is a valuable resource for those beginning their journey with Power BI. The playlist includes a range of videos that cover various aspects of Power BI, from basic introductions to more detailed tutorials.
For example, the video “What is Power BI? (2021)” provides a foundational understanding of what Power BI is and its capabilities. Another video, “Create your first Power BI report (2021),” guides viewers through the process of creating their first report, offering practical experience with the tool.
The playlist also includes videos like “Power BI Get Data: Import vs. DirectQuery vs. Live (2021),” which delve into more specific functionalities of Power BI, helping viewers understand different data handling methods within the software.
Joined: Dec 3, 2014
Views: 44,685,760 views
Subscribers Count: 538K subscribers
Consistency of Updates: Weekly 2 videos
Total Number of Videos: 1204 videos (Playlist: 10 videos)
Average Duration of Videos: 10 minutes
Teaching Style: Clear and concise explanations, often using real-world examples. Friendly and approachable, making learning Power BI less complex.
Interactive Elements: Uses screen recordings and demonstrations. Regular live streams.
Language: English
2. Alex The Analyst
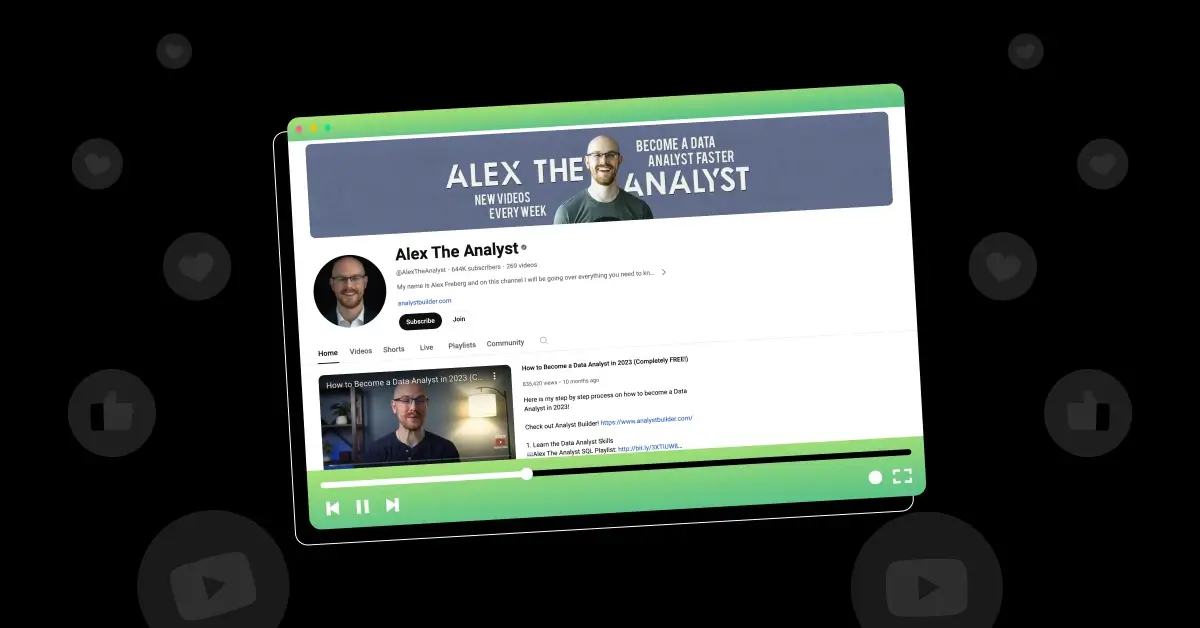
The “Alex The Analyst” YouTube playlist titled “Data Analyst Bootcamp” is a comprehensive and free educational resource for anyone aspiring to become a data analyst. This playlist is YouTube’s first free Data Analyst Bootcamp, complete with a range of videos and projects.
The playlist includes a variety of videos that cover essential topics for data analysts. For example, the video “FREE Data Analyst Bootcamp!!” introduces viewers to the bootcamp and what they can expect to learn.
Another video, “How to Become a Data Analyst in 2023 (Completely FREE!),” provides guidance on starting a career in data analysis.
The playlist also features detailed tutorials on SQL, such as “SQL Basics Tutorial For Beginners” and “Intermediate SQL Tutorial,” which break down complex SQL concepts into understandable segments.
There are videos on other key tools and skills, including Excel, Tableau, and Python, such as “Pivot Tables in Excel” and “Installing Jupyter Notebooks/Anaconda | Python for Beginners.”
Joined: Jan 8, 2020
Views: 62,452,034 views
Subscribers Count: 1.32M subscribers
Consistency of Updates: Weekly one video
Total Number of Videos: 436 videos (Playlist: 70 videos)
Average Duration of Videos: 10 minutes
Teaching Style: Friendly, approachable, breaks down complex SQL concepts
Interactive Elements: Active community forum, regular live streams
Language: English
3. Andy Kriebel
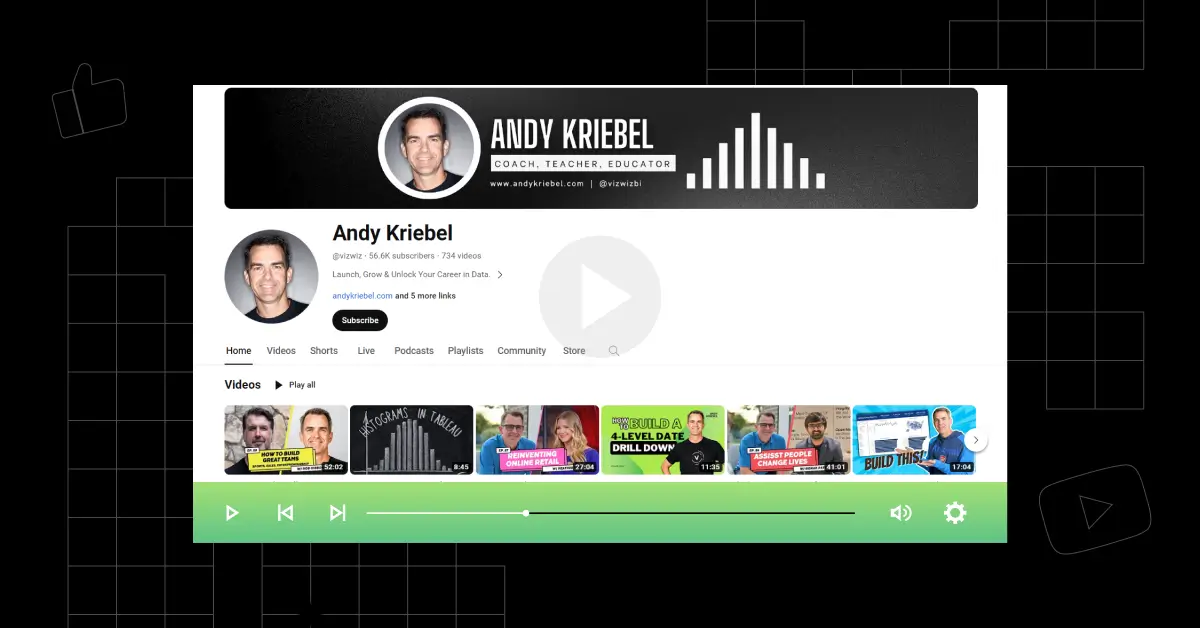
The “Andy Kriebel” YouTube playlist titled “Tableau Tips” is a treasure trove of information for anyone interested in mastering Tableau, a popular data visualization tool.
The playlist includes a wide range of topics, from basic functionalities to advanced techniques in Tableau. For example, videos like “Harnessing Histograms for Data Analysis in Tableau” and “How to Create a Year→Quarter→Month→Day Drilldown in Tableau” provide viewers with practical skills for data analysis and visualization.
The playlist also features videos on more complex topics, such as “Master Containers: Build an Interactive Tableau Dashboard From Scratch” and “Enhancing Tableau Drill-Downs: Use LODs in Hierarchies,” which delve into advanced functionalities of Tableau.
The playlist includes tutorials on creating various types of charts and visualizations, such as barbell charts, jitter plots, and radial bubble charts, offering a comprehensive learning experience.
Joined: Nov 9, 2006
Views: 9,545,154 views
Subscribers Count: 78.6K subscribers
Consistency of Updates: Weekly 1 video
Total Number of Videos: 821 videos (Playlist: 350 videos)
Average Duration of Videos: 10 minutes
Teaching Style: Relaxed and conversational with humor and anecdotes, long discussions packed with valuable information.
Interactive Elements: Code examples, whiteboards, live sessions, and podcasts.
Language: English
4. Akshit Madan
The “Akshit Madan” YouTube playlist titled “Data Analysis & Visualisation for Beginners (Pandas, Numpy, Matplotlib, Seaborn)” is a complete guide for those starting in data analysis and visualization.
The playlist includes a series of tutorials that cover the basics and advanced functionalities of libraries like Numpy, Pandas, Matplotlib, and Seaborn.
For example, videos like “Part 1: Numpy Introduction and Basic Operations | Numpy Tutorial” and “Part 2: Numpy Functions Tutorial np.ones, np.zeros, np.empty | Numpy Tutorial” provide foundational knowledge in Numpy.
The playlist offers comprehensive tutorials on Pandas, such as “Part 1 – Pandas Series with Lists/Dictionaries | Pandas Complete Tutorial” and “Part 2 – Pandas DataFrame and Reading CSV Files | Pandas Complete Tutorial.”
There are videos on data visualization using Matplotlib and Seaborn, like “Line Plot in Seaborn | Part 1 | Seaborn Complete Tutorial” and “Scatter Plot in Matplotlib | Complete Tutorial Playlist | Data Visualisation.”
Joined: Mar 6, 2014
Views: 7,176,704 views
Subscribers Count: 67.1K subscribers
Consistency of Updates: Weekly 2 videos
Total Number of Videos: 374 videos (Playlist: 32 videos)
Average Duration of Videos: 10 minutes
Teaching Style: Enthusiastic and fast-paced. Focuses on practical learning.
Interactive Elements: Code breakdowns, live streams, and links to additional resources.
Language: English
5. storytelling with data
The “storytelling with data” YouTube playlist titled “Featured videos” is a rich resource for anyone interested in enhancing their data visualization and presentation skills.
The playlist includes a variety of videos that cover different aspects of data presentation and visualization. For example, videos like “Sketch your data: bring a table to life” and “Make waterfall charts in Excel (the EASY way!)” provide practical advice on creating impactful visualizations.
The playlist also features videos on improving presentation skills, such as “#1 tip for better presentations” and “How to turn data into stories,” which offer insights into transforming data into compelling narratives.
There are videos focused on specific tools and techniques, like “Line graphs & slopecharts: what you should know” and “Create beautiful custom color palettes in PowerPoint,” which help viewers improve their technical skills in data visualization.
Joined: Oct 11, 2011
Views: 2,252,462 views
Subscribers Count: 77K subscribers
Consistency of Updates: Monthly one video
Total Number of Videos: 162 videos (Playlist: 38 videos)
Average Duration of Videos: 10 minutes
Teaching Style: Clear and engaging. Uses real-world examples and case studies. Shares tips and tricks.
Interactive Elements: Live streams. Additional resources are shared in the description.
Language: English
6. Data Science Tutorials
The “Data Science Tutorials” YouTube playlist titled “Plotly Python Tutorials – data visualization in python” is an excellent resource for anyone interested in learning about data visualization using Plotly, a popular Python library.
The playlist includes a series of tutorials that cover various aspects of data visualization with Plotly. For example, videos like “Plotly Python – Introduction of plotly data visualization and creating plotly chart” and “Plotly Python – Introduction of plotly data visualization and creating plotly scatter chart” provide beginners with a solid foundation in Plotly.
The playlist also features more advanced tutorials, such as “Plotly Python – Data Visualization in Python with Real Data | Adding Layout to plotly Chart” and “Plotly Python – Plotly bar chart | Plotly Python data visualization,” which delves into specific types of visualizations and techniques.
There are videos on creating multi-line charts, bar charts, bubble charts, and even complex visualizations like scatter plot matrices, offering a comprehensive learning experience.
Joined: Nov 1, 2015
Views: 8,868,958 views
Subscribers Count: 69.2K subscribers
Consistency of Updates: Weekly one video
Total Number of Videos: 1172 videos (Playlist: 20 videos)
Average Duration of Videos: 10 minutes
Teaching Style: Practical with hands-on demonstration, short and to the point.
Interactive Elements: Screen sharing, datasets in the description.
Language: English
7. The Information Lab
The “The Information Lab” YouTube playlist titled “AI + Data Viz” is a unique and insightful resource for anyone interested in integrating Artificial Intelligence (AI) into their data visualization workflow.
The playlist includes a series of videos that delve into various aspects of using AI in data visualization. For example, the video “How AI can help you build a viz with Will Sutton” discusses the potential of AI in assisting with visualization creation.
Another video, “Can ChatGPT help you Build a Viz in Tableau? (Spoiler: it can!),” explores the practical application of AI language models like ChatGPT in Tableau, a popular data visualization tool.
The playlist also features videos on more specific applications, such as “Using ChatGPT To Create Fake Datasets” and “Use AI To Build Venn Diagrams For Tableau,” demonstrating innovative ways to utilize AI in data visualization tasks.
There are videos like “Build Your Own Tableau Certified Analyst Exam GPT” and “Make A Personalised Data-Themed Christmas Cards Generator,” which showcase creative and practical uses of AI in the field of data visualization.
Joined: Oct 23, 2014
Views: 3,627,505 views
Subscribers Count: 22K subscribers
Consistency of Updates: Weekly 2 videos
Total Number of Videos: 663 videos (Playlist: 8 videos)
Average Duration of Videos: 5 minutes
Teaching Style: Best to learn data visualization best practices. Videos are created by experts in the field, and they cover a wide range of topics.
Interactive Elements: Screen recordings, code examples, whiteboards.
Language: English
8. PyLenin
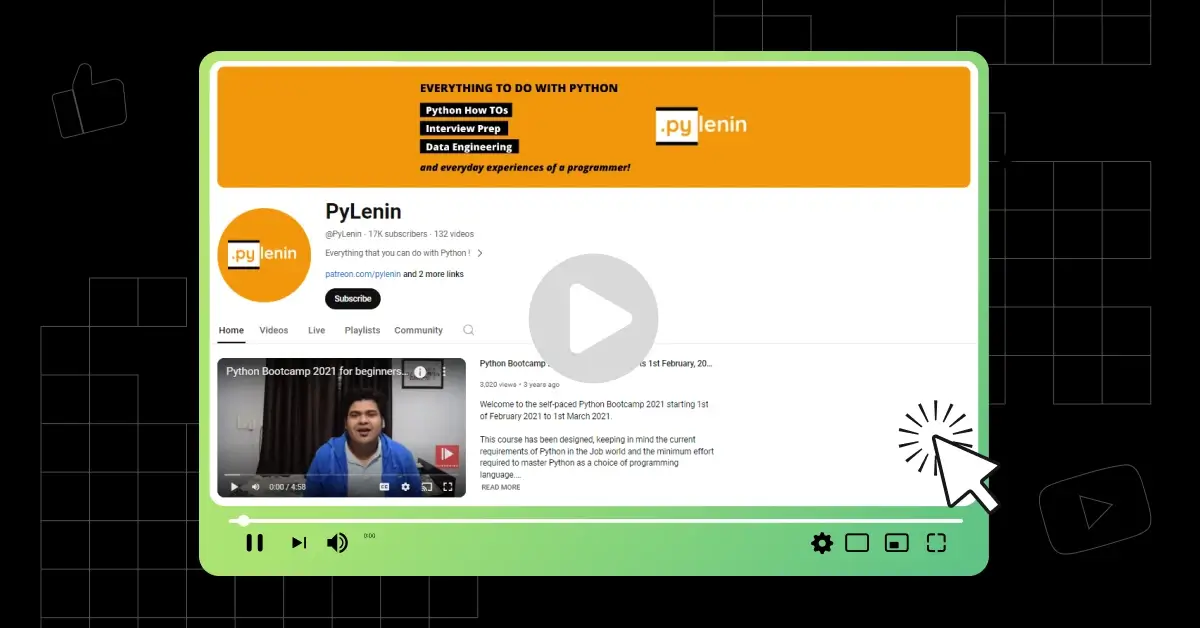
The “PyLenin” YouTube playlist titled “Data Visualization with Matplotlib for beginners” is an excellent resource for anyone looking to learn data visualization using Matplotlib, a popular Python library.
The playlist includes a series of tutorials that cover the basics and advanced functionalities of Matplotlib. For example, the video “Matplotlib Tutorial 1 | Installing matplotlib library” guides viewers through the initial setup process. Subsequent videos, such as “Matplotlib Tutorial 2 | Plotting data from lists using Pyplot API” and “Matplotlib Tutorial 3 | Adding labels and legends,” provide foundational knowledge in creating and customizing plots.
The playlist also features tutorials on more specific visualization techniques, such as “Matplotlib Tutorial 10 | Scatter Plots,” “Matplotlib Tutorial 11 | Bar Charts,” and “Matplotlib Tutorial 12 | Histograms,” offering a comprehensive learning experience in various types of data visualizations.
There are videos like “Matplotlib Tutorial 14 | Text Annotations” and “Matplotlib Tutorial 15 | Using Style Sheets,” which delve into enhancing the aesthetic and functional aspects of visualizations.
Joined: Oct 13, 2018
Views: 1,187,653 views
Subscribers Count: 16.8K subscribers
Consistency of Updates: Currently inactive
Total Number of Videos: 133 videos (Playlist: 15 videos)
Average Duration of Videos: 5 minutes
Teaching Style: Concise and to the point. Focus on practical learning.
Interactive Elements: Live streams and screen casting.
Language: English
9. Data Visualization Society
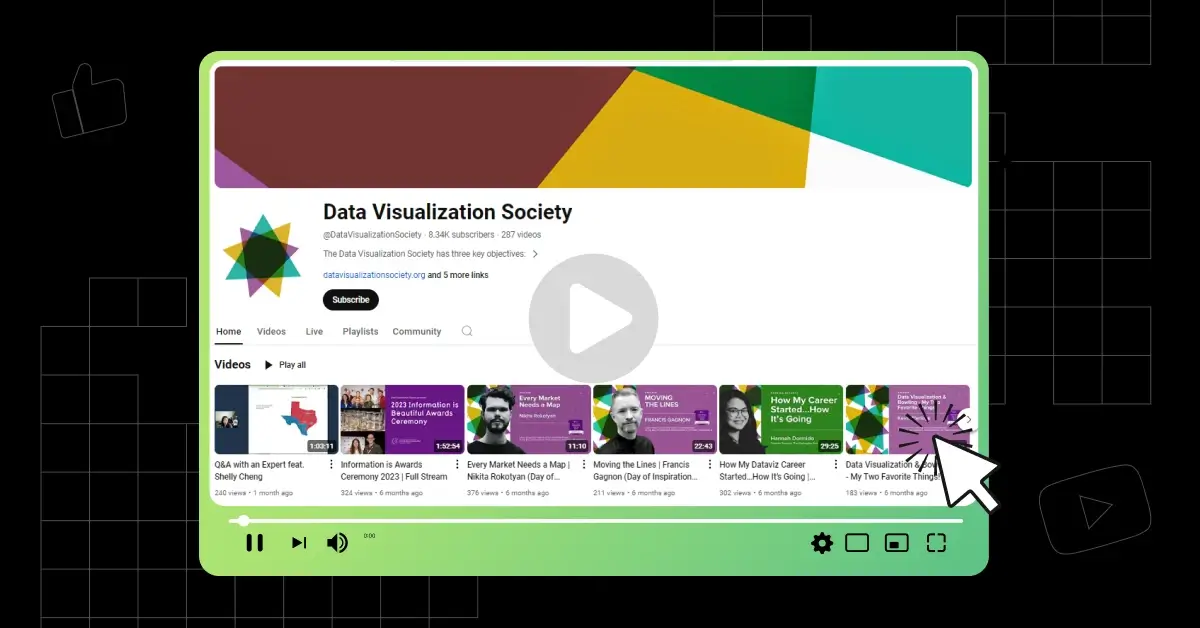
The “Data Visualization Society” YouTube playlist titled “Outlier 2022” is a curated collection of talks, lightning talks, and Q&A sessions from the 2022 edition of the Outlier conference.
The playlist features a variety of talks covering a wide range of data visualization topics. For example, “Mollie Pettit, Evelina Judeikyte—Welcome to Outlier 2022!” introduces the conference and sets the tone for the discussions. Other videos, such as “Andy Kirk—Outlier 2022—The 2022 Data Viz Healthcheck: How’s it Going?” and “Kat Greenbrook—Outlier 2022—My Plastic Footprint: a Physical Data Visualisation Project,” delve into specific aspects of data visualization, from industry trends to innovative project showcases.
The playlist also includes talks on more niche topics, like “Zan Armstrong—Outlier 2022—Three Simple, Flexible Tools for Empowered Data Visualization” and “Alex Garcia—Outlier 2022—Command Line Data Visualizations,” providing a comprehensive view of the field’s current state and future directions.
Joined: Oct 9, 2019
Views: 247,994 views
Subscribers Count: 9.95K subscribers
Consistency of Updates: Weekly one video
Total Number of Videos: 379 videos (Playlist: 71 videos)
Average Duration of Videos: 20 minutes
Teaching Style: Academic approach, focusing on the theoretical underpinnings of data visualization. Their videos are mostly discussions and meetings with industry experts and provide field experience and practical knowledge.
Interactive Elements: Regular live streams and conferences.
Language: English
10. DataCamp
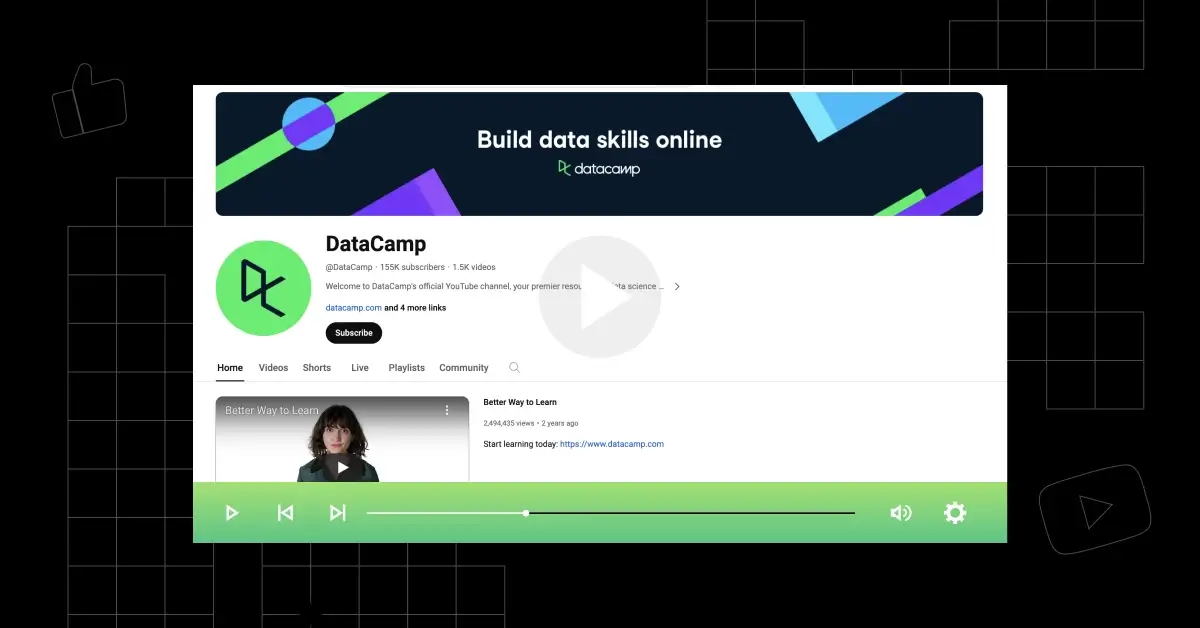
The “DataCamp” YouTube playlist titled “R Tutorials for Data Science” is an invaluable resource for anyone interested in learning R, a programming language widely used in data science.
The playlist includes a series of tutorials that cover a wide range of topics in R programming and data science. For example, videos like “R tutorial: The TDM & DTM with text mining” and “R tutorial: Cleaning and preprocessing text” provide insights into text mining and data preprocessing in R.
Other videos, such as “R tutorial: Getting started with text mining?” and “R tutorial: What is text mining?” offer foundational knowledge for those new to these concepts.
The playlist also features tutorials on exploratory data analysis, statistical modeling, and specific R functions, such as “R tutorial: Using tapply() for comparisons” and “R tutorial: Subsets and histograms.”
There are videos on more advanced topics like “R Tutorial: Introduction to Statistical Modeling in R” and “R tutorial: Cross-validation,” which delve into statistical modeling and model validation techniques.
Joined: Mar 25, 2014
Views: 28,795,905 views
Subscribers Count: 207K subscribers
Consistency of Updates: Weekly 2 videos
Total Number of Videos: 2,384 videos (Playlist: 16 videos)
Average Duration of Videos: Varies, with a focus on comprehensive coverage
Teaching Style: Structured, project-based, presentation-based.
Interactive Elements: Teaching through presentations, and detailed notes in the description of each video.
Language: English
Final Words
These channels are like your personal data art teachers, showing you how to turn boring spreadsheets into awesome, easy-to-understand visual stories.
Keep checking this article as we will keep updating this space as more YouTube channels make space in the heart and study schedule of students preparing for placements and competitive exams.
Explore More Data Visualization Resources
Explore More YouTube Channels
- Python
- Java
- C++
- C Programming
- AI and Machine Learning
- SQL
- JavaScript
- Data Structures and Algorithms
- HTML and CSS
- Competitive Programming
- DBMS
- R Programming
- PHP
- Cyber Security
- Automation Testing
- Excel
- Web Development
- Coding
- Android Development
- Power BI
- Tableau
- Bootstrap
- Game Development
- Digital Marketing
- Data Science
- Ethical Hacking
- Data Analytics
- UI/UX Design
- DevOps
- Cloud Computing
- WordPress
- Rust
- Django
- Engineering Mathematics
- Discrete Mathematics
FAQs
The best YouTube channels for learning Data Visualization are:
- Guy in a Cube
- Alex The Analyst
- Andy Kriebel
- Akshit Madan
- storytelling with data
YouTube offers diverse teaching styles, practical examples, and a wide range of Data Visualization content for free, suitable for all learning levels.
Look for channels that match your learning style, cover the topics you’re interested in, and have positive user engagement and reviews for learning Data Visualization.
Yes, many YouTube channels provide beginner-friendly Data Visualization tutorials with step-by-step instructions and real-world examples.
Instructor expertise is crucial as it ensures accurate, up-to-date information and effective teaching methods for Data Visualization.
Yes, some channels like Guy in a Cube and Alex The Analyst offer Data Visualization content in multiple subtitles, catering to a diverse audience.


Thirumoorthy serves as a teacher and coach. He obtained a 99 percentile on the CAT. He cleared numerous IT jobs and public sector job interviews, but he still decided to pursue a career in education. He desires to elevate the underprivileged sections of society through education


Thirumoorthy serves as a teacher and coach. He obtained a 99 percentile on the CAT. He cleared numerous IT jobs and public sector job interviews, but he still decided to pursue a career in education. He desires to elevate the underprivileged sections of society through education
Related Posts
Process vs Thread: Key Differences Explained with Examples
Applications like Chrome, VS Code, and Spotify can perform multiple tasks simultaneously, such as loading files, playing media, and handling …
Warning: Undefined variable $post_id in /var/www/wordpress/wp-content/themes/placementpreparation/template-parts/popup-zenlite.php on line 1050
so far feels like...
